The one billion row challenge 😱
Last updated on
Welcome to this new project where we crack open a one-billion-row CSV file. Yes, ONE BILLION!
This is a very fun challenge created by Gunnar Morling .
Your mission, should you choose to accept it, is deceptively simple: write a Java program for retrieving temperature measurement values from a text file and calculating the minimum, mean, and maximum temperatures per weather station. There’s just one caveat: the file has 1,000,000,000 rows!
Instead of using a Java program, we will use TypeScript, of course, with the Simple Data Analysis library (SDA), which I created (give it a ⭐ ). This is a great opportunity to test how powerful it can be!
If you get stuck at any point in this project, it might be helpful to review the previous lessons in Chapter 3, especially Setup and Tabular data, which explain the basics of SDA.
Let’s code!
Setup
Create a new empty folder somewhere handy on your computer and open it in VS Code. Then open the terminal in VS Code.
We’ll use @nshiab/setup-data-project, a library I created to install the libraries and set up all the files and configuration we need for a project. Run this command in the terminal:
npx @nshiab/setup-data-project --sdaIf prompted to install the library, type y and press Enter.
The --sda option automatically selects the simple-data-analysis library for installation.
Once the terminal says You are all set!, open sda/main.ts. You’ll see some starter code in it.
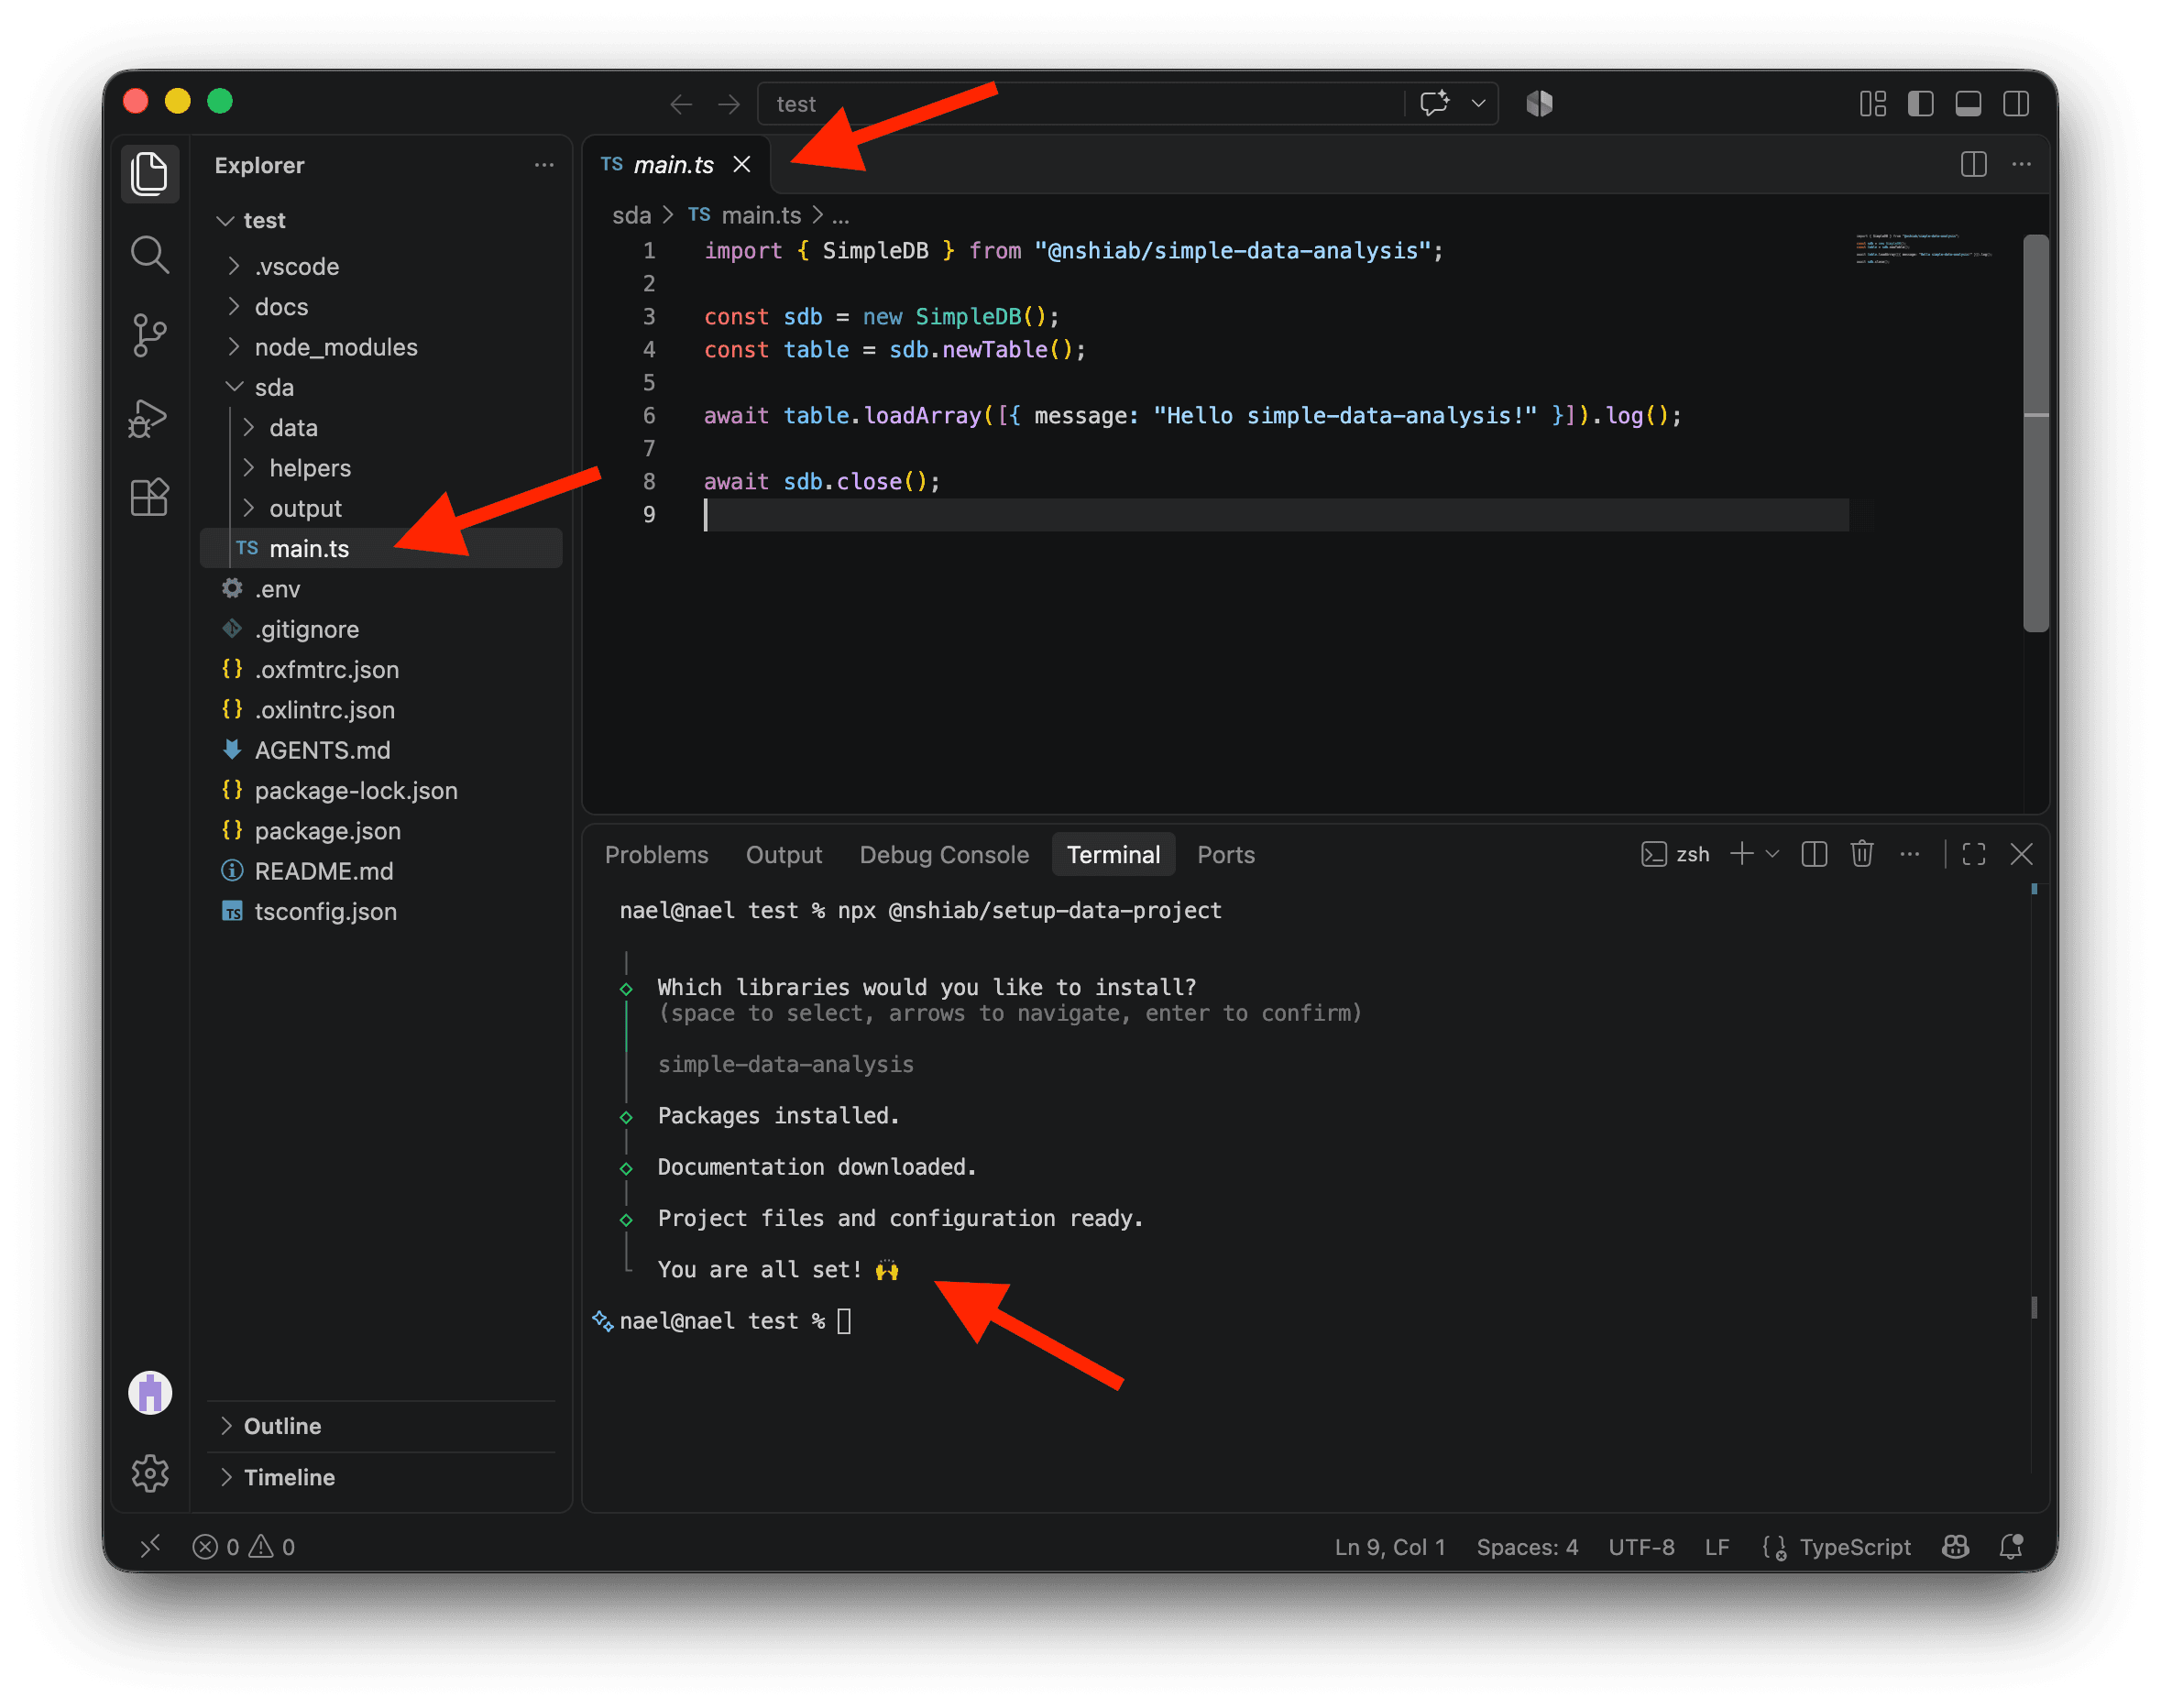
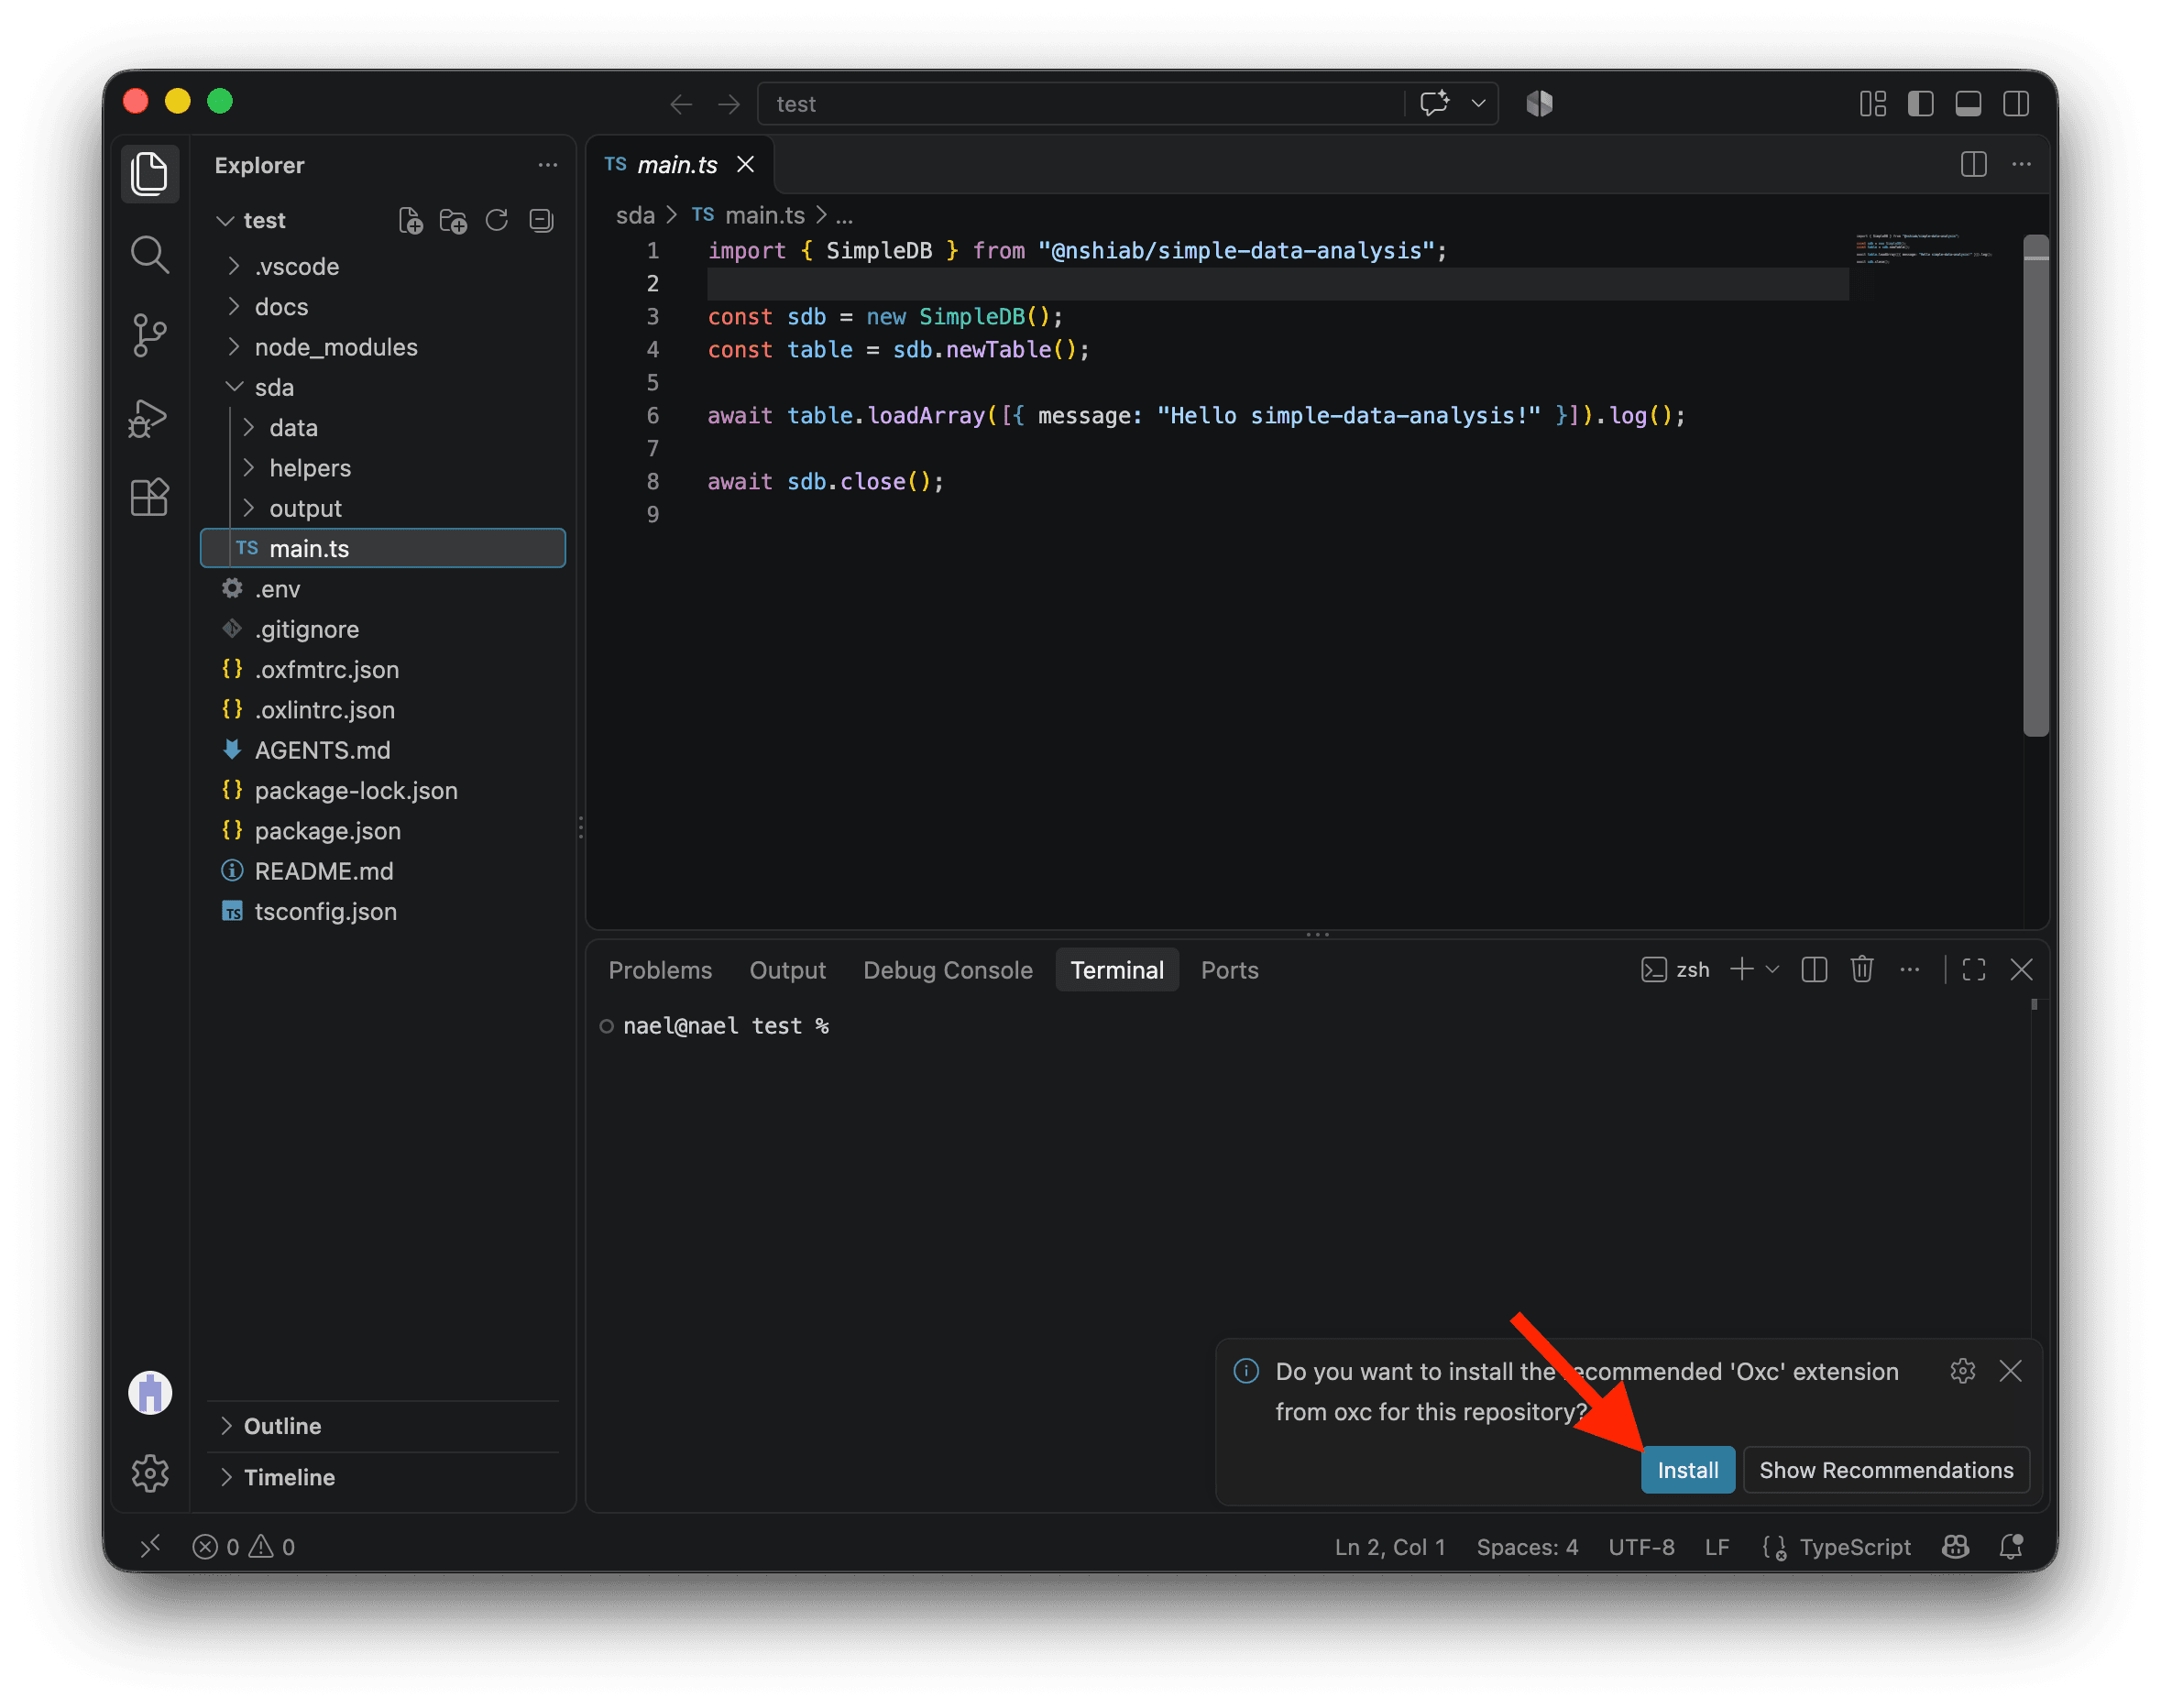
If VS Code asks you to install the recommended Oxc extension, click Install. It helps format your code and find potential problems as you work.
We’re now ready to watch sda/main.ts. Run the command below. Every time you save the file, it will automatically format, check, and run your code:
npm run sda:watchIf you ever need to stop watching, click the terminal and press Ctrl+C on Mac or Windows.
Keep the watcher running while you work through this project.
The data
In the original challenge, you have to fork a GitHub repo and run a script to generate a CSV file with 1 billion rows of data. I generated it for you and uploaded a course-owned copy to Google Drive.
Download the data from here . It might take a few minutes since it’s around 4 GB.
Then put it in your sda/data folder and unzip it. The uncompressed version of the CSV file is around 13 GB.
To load the data, add this code to sda/main.ts. Depending on your computer, it might take a few seconds to a few minutes to run.
import { SimpleDB } from "@nshiab/simple-data-analysis";

const sdb = new SimpleDB({ logDuration: true });

await sdb
  .newTable()
  .loadData("sda/data/measurements.csv")
  .log();

await sdb.close();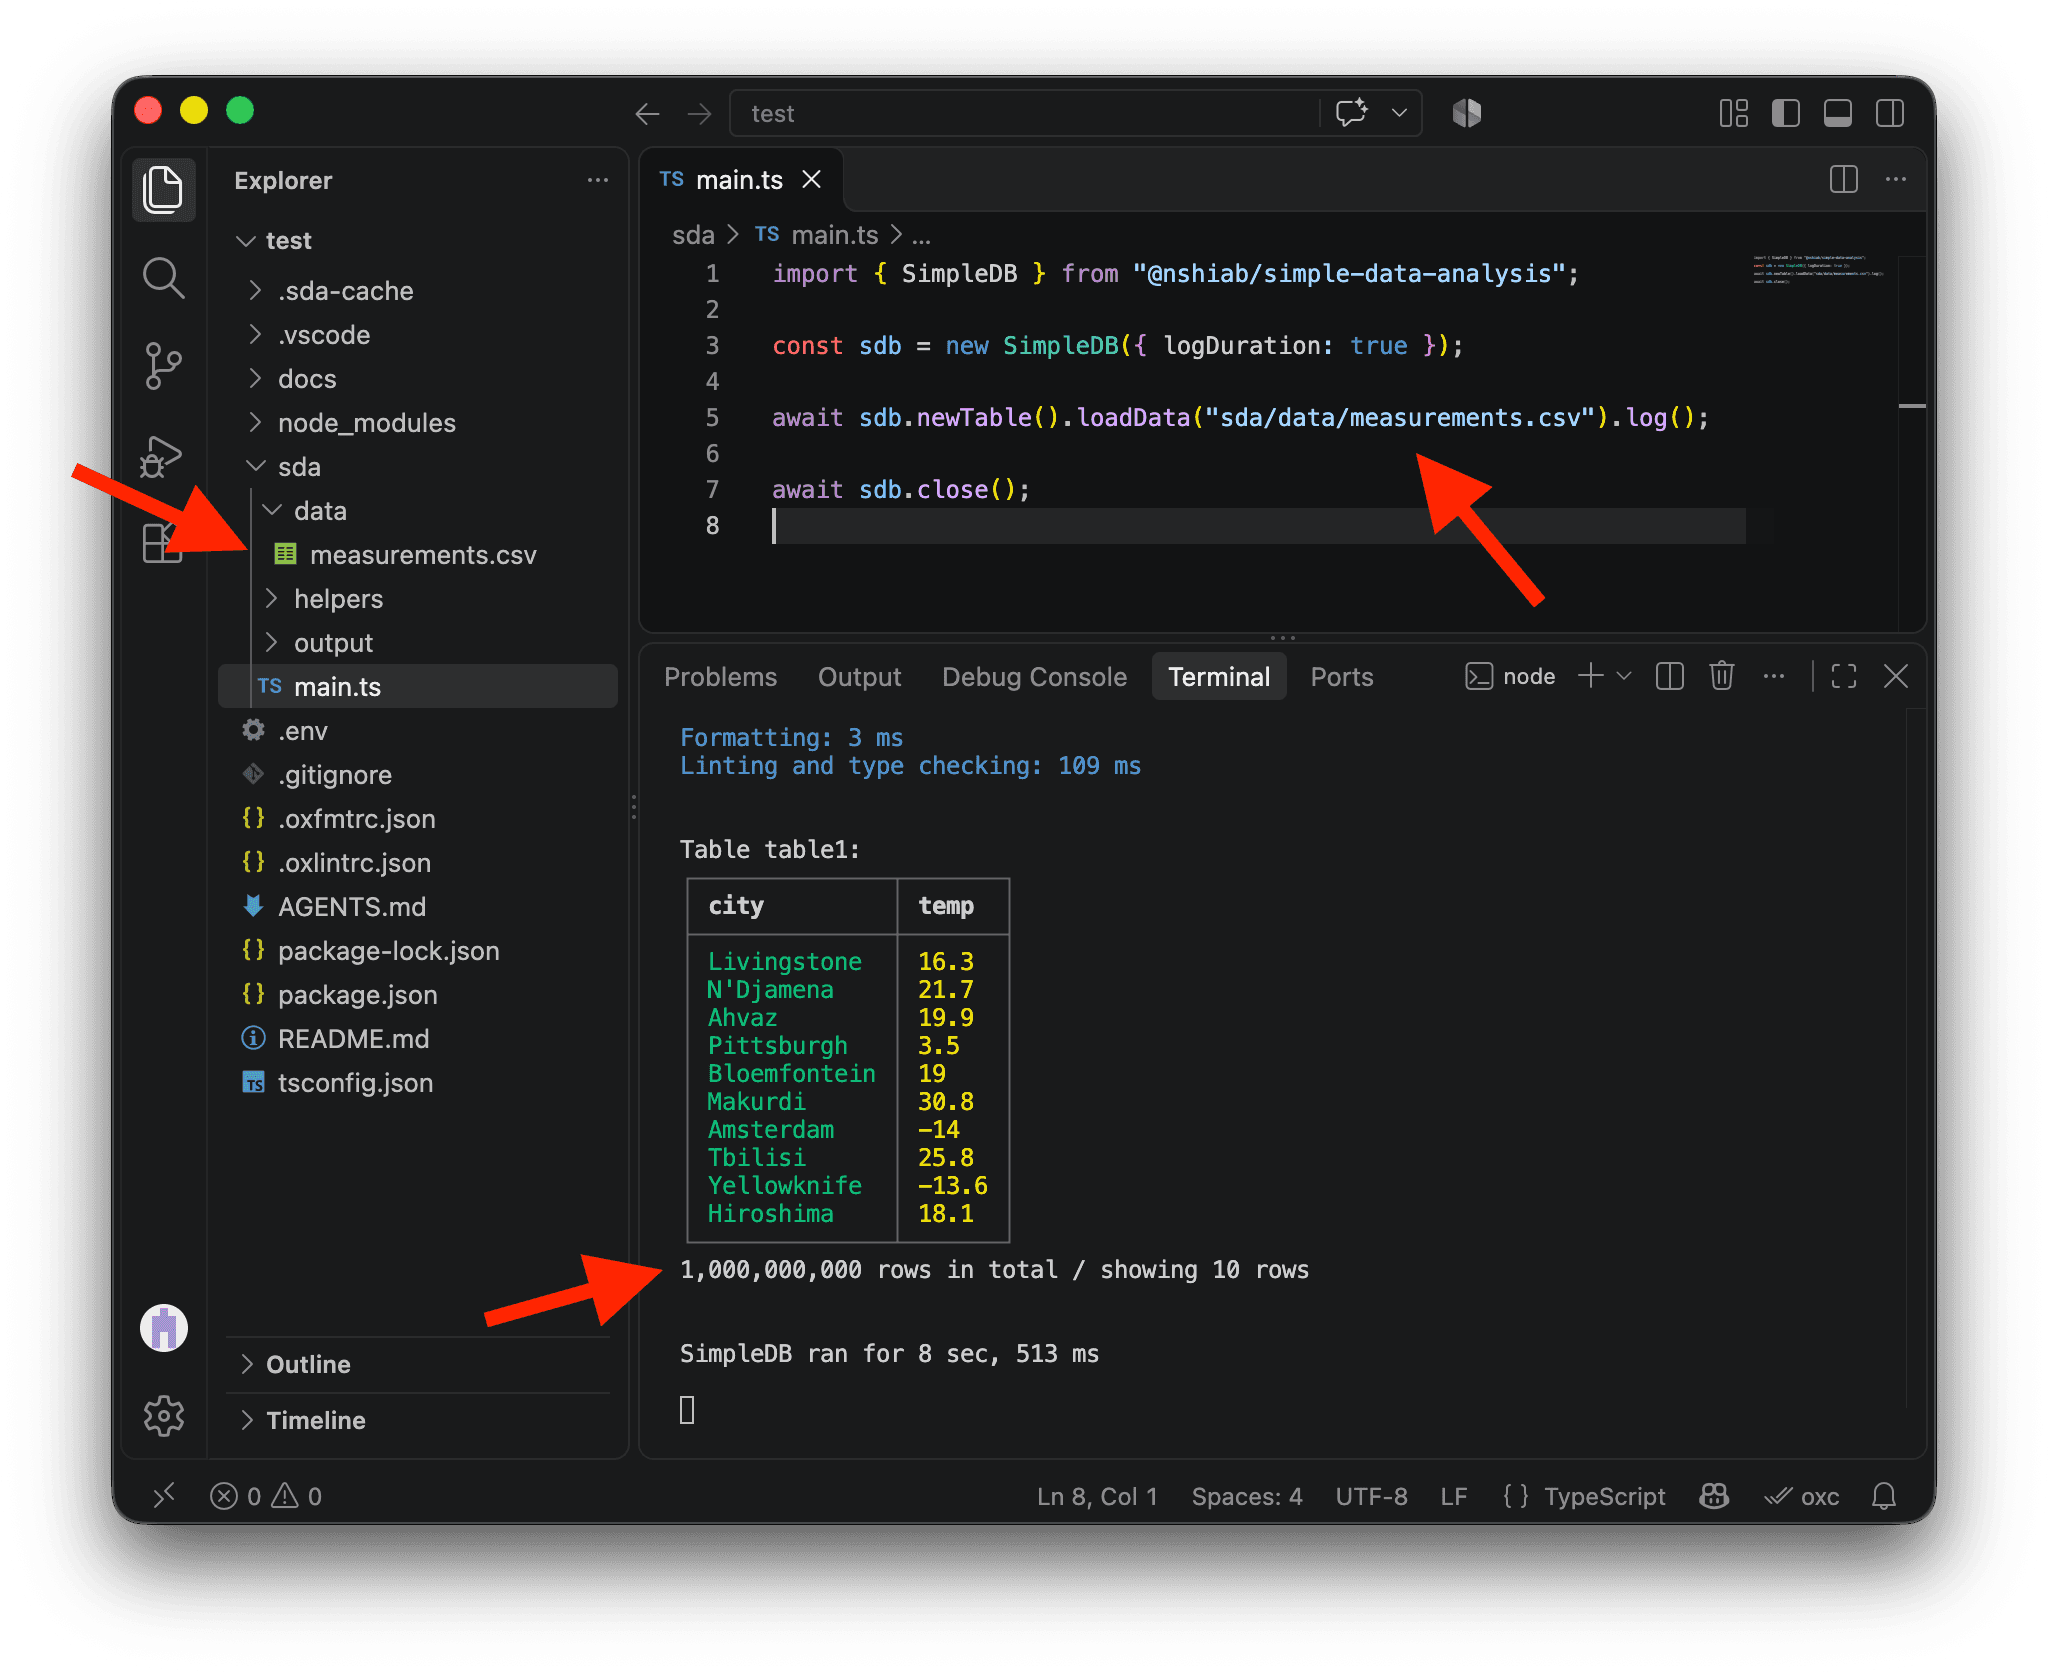
Congratulations! You just loaded 1,000,000,000 rows of data! As you can see, it takes roughly eight seconds on my M4 Max, which is quite impressive for a CSV file of this size. 🥳
Depending on the RAM available on your computer, you might see a .tmp folder appearing in your project. If the data is bigger than your RAM, this folder will be used to process all of it by storing processed chunks in it.
This .tmp folder can become quite big. But don’t worry: when you set up a project with @nshiab/setup-data-project, it is automatically added to .gitignore, so you don’t accidentally commit and push it to GitHub or elsewhere.
You can remove .tmp manually, although I usually don’t bother. Running npm run clean will remove it too, but be careful: it will also delete all cached data in .sda-cache.
The challenge
As you can see above, the data is just a list of cities with temperatures.
Now, the challenge is to compute the minimum, mean, and maximum temperatures per city. The results also need to be sorted alphabetically by city.
This is very easy with SDA. We only need to call one method, summarize, to perform the computations. We don’t even need to sort the rows manually because summarize does it by default.
import { SimpleDB } from "@nshiab/simple-data-analysis";

const sdb = new SimpleDB({ logDuration: true });

await sdb
  .newTable()
  .loadData("sda/data/measurements.csv")
  .summarize({
    columns: "temp",
    by: "city",
    stats: ["min", "mean", "max"],
  })
  .log();

await sdb.close();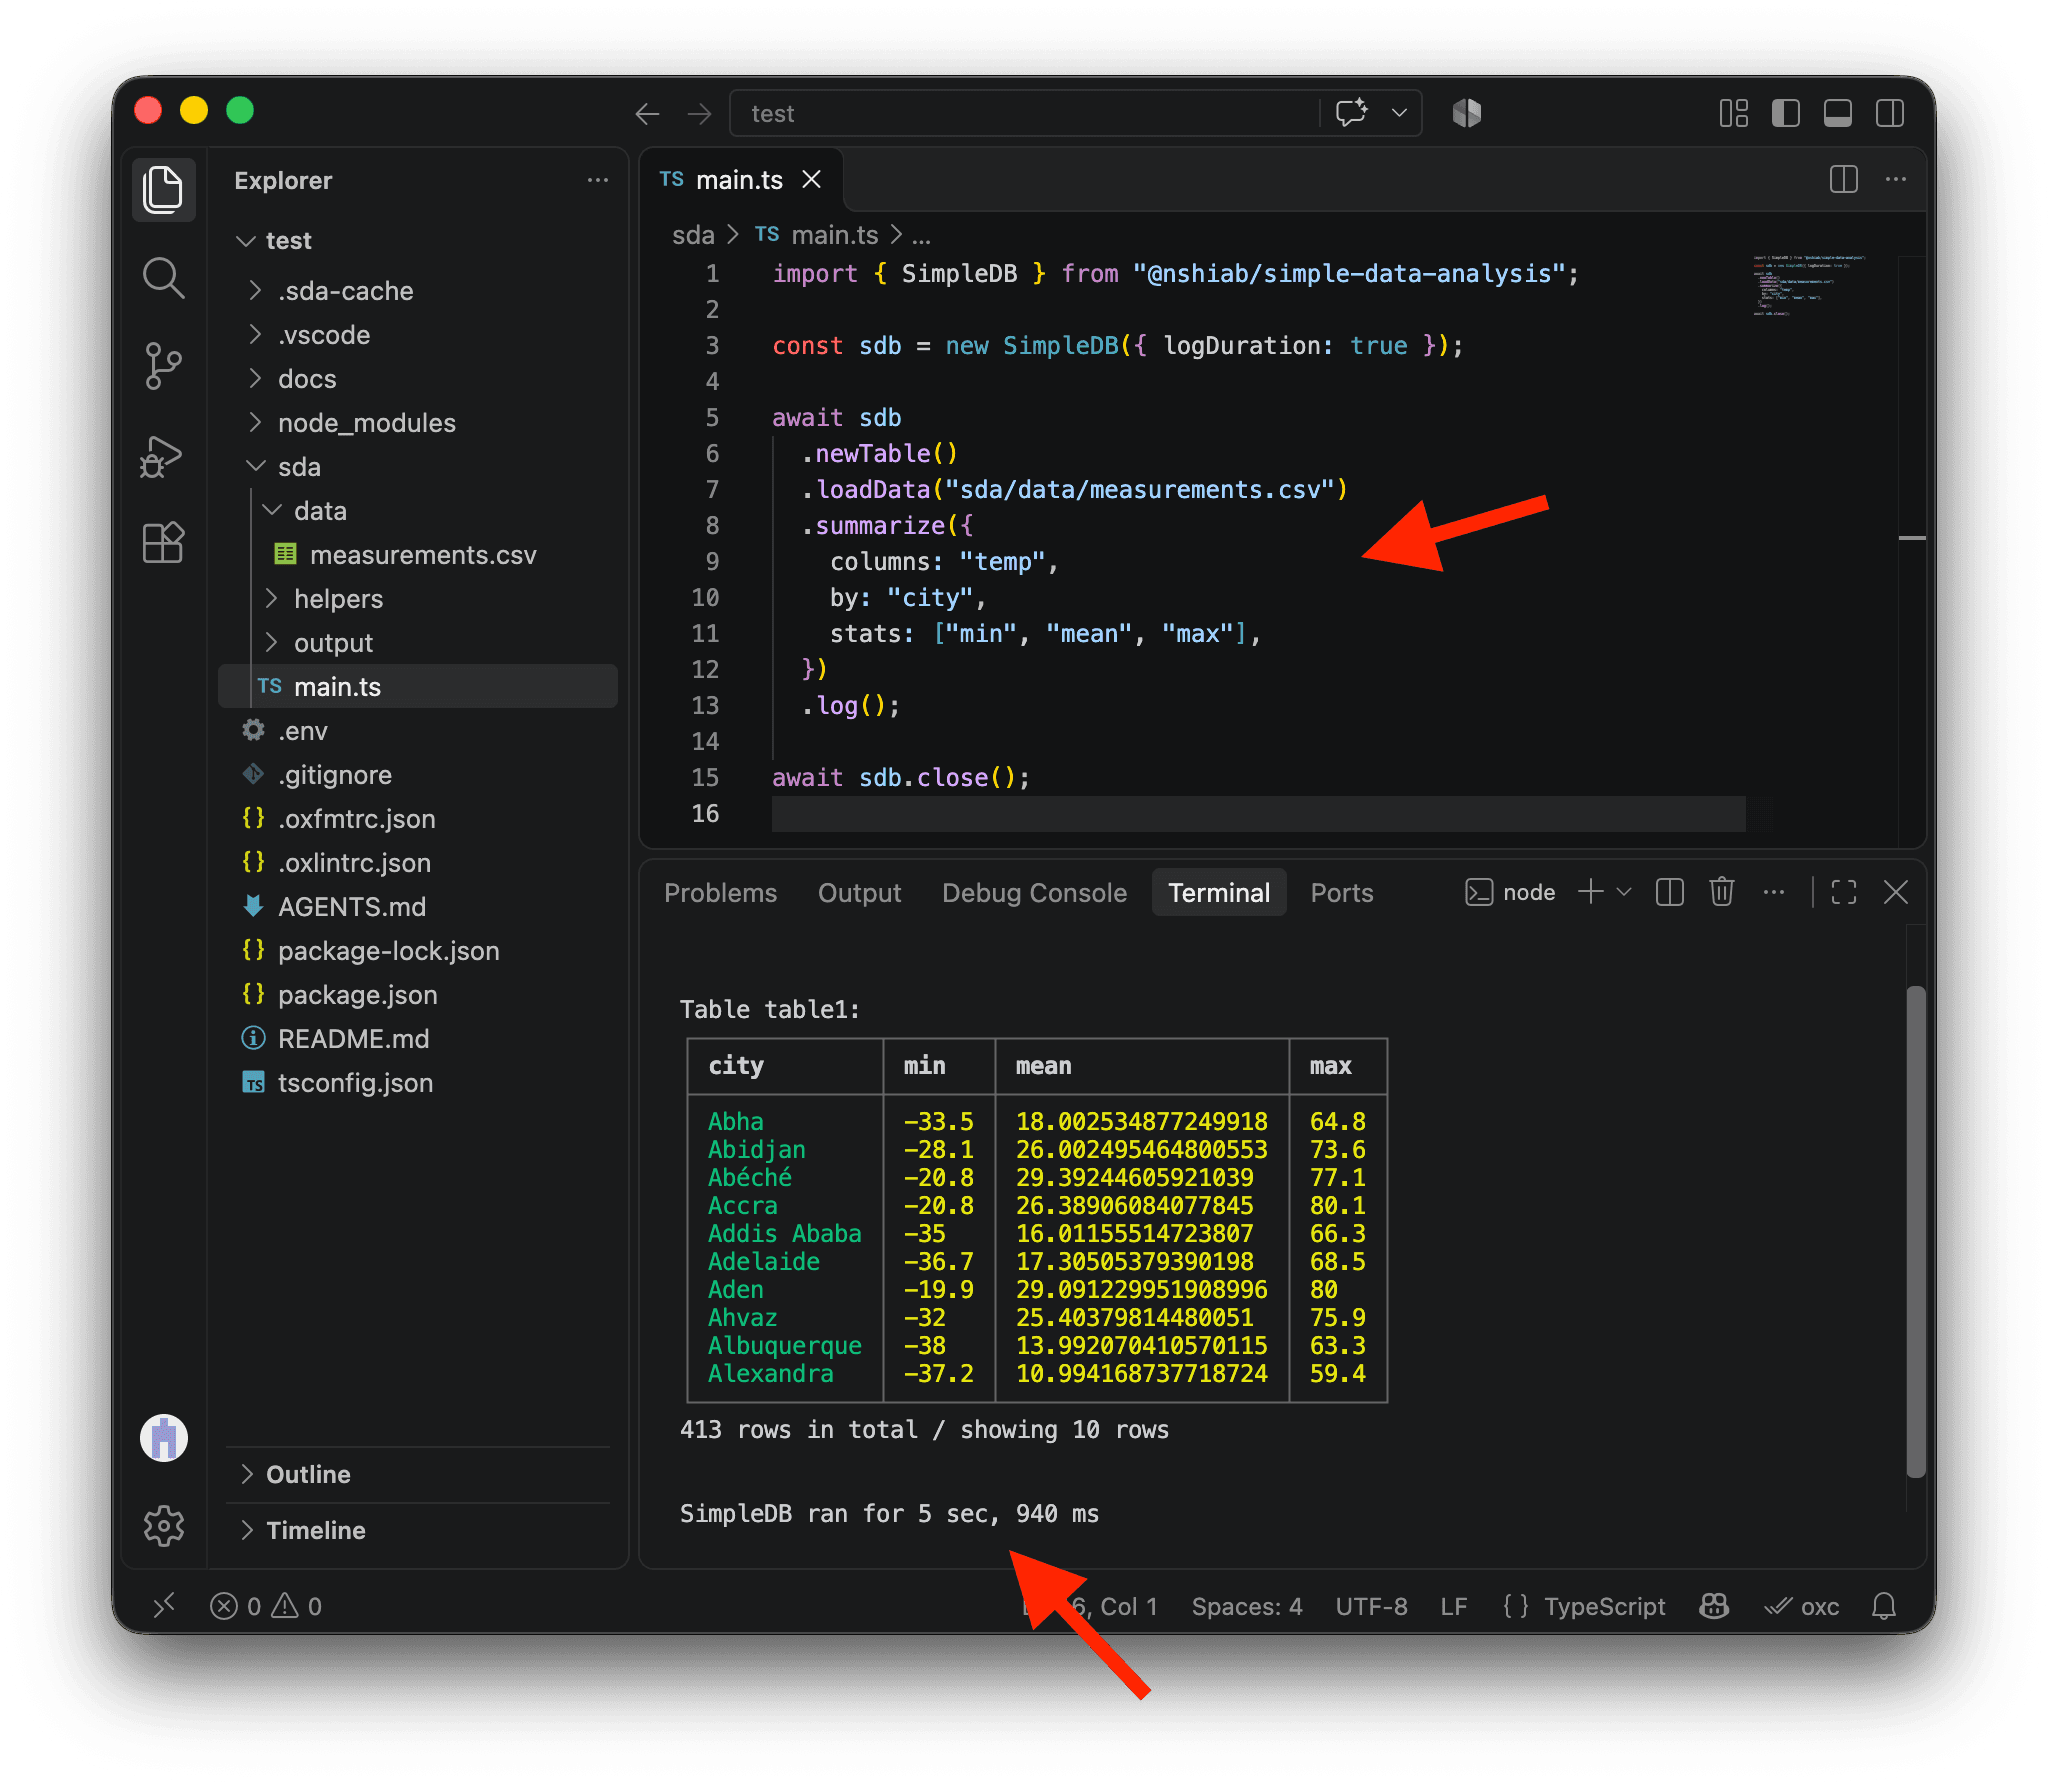
On my machine, this runs even faster than simply loading the CSV file because the final table is much smaller than the full one-billion-row table. Everything is processed on the fly, which is quite incredible. 🚀
But… how?
While SDA is a TypeScript library, under the hood it uses DuckDB , a very fast database system written in C++. When you use methods like loadData or summarize, SDA translates everything into SQL and asks DuckDB to execute it.
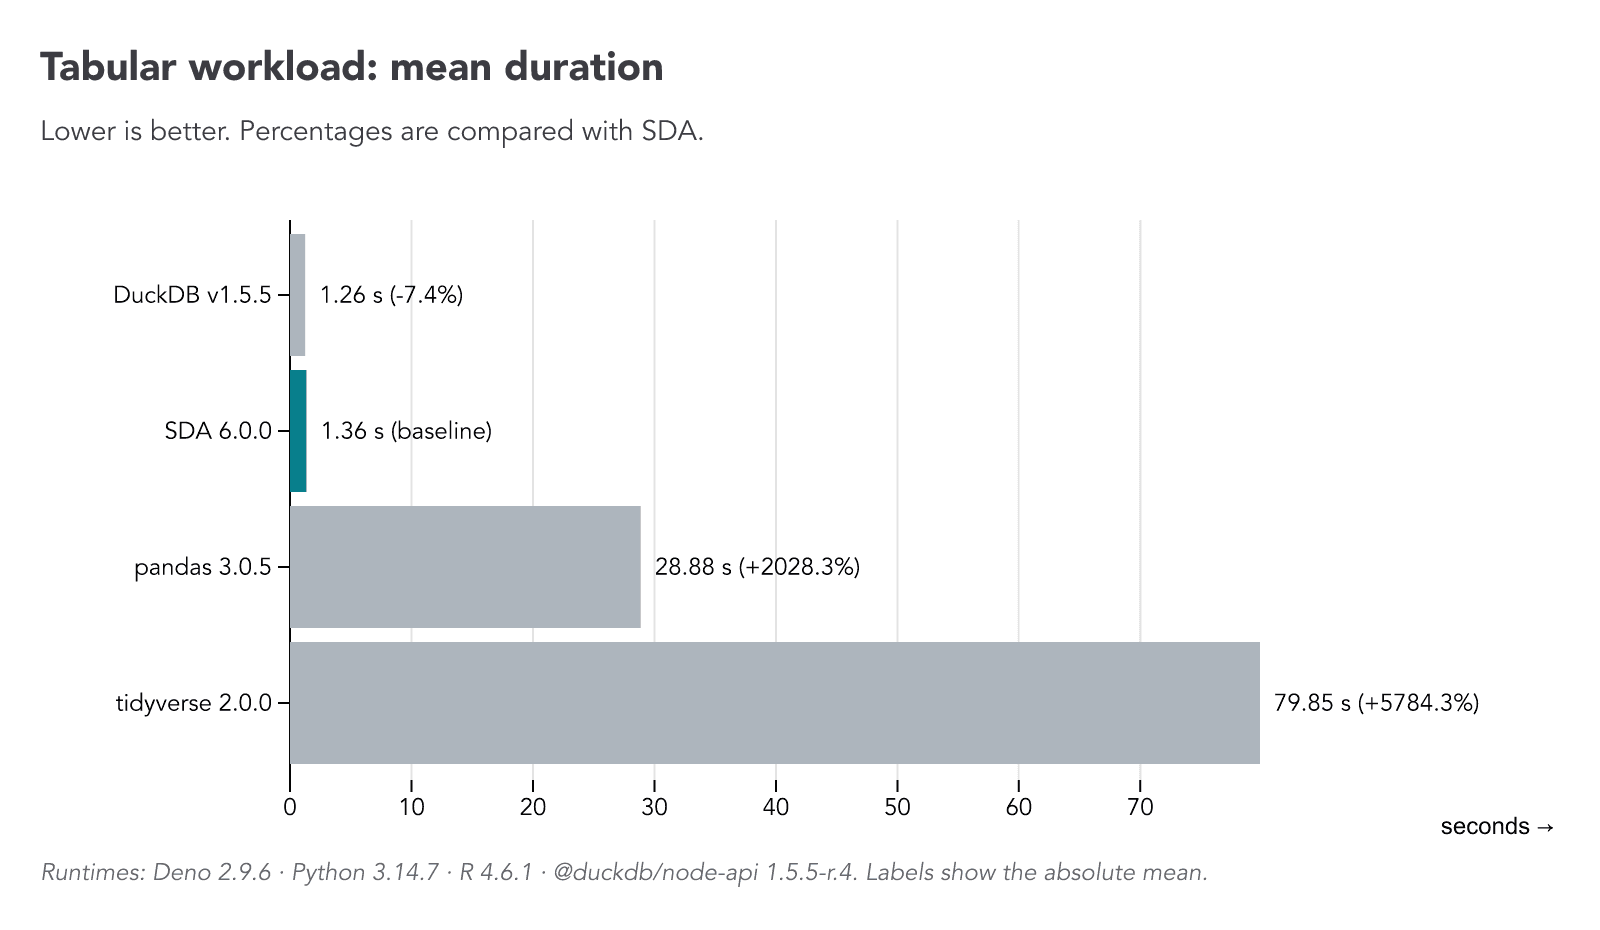
To compare SDA with other popular options, including DuckDB, I ran a few benchmarks on my MacBook Pro M4 Max, as described below.
Tabular data
For tabular data, I ran a test with the Adjusted and Homogenized Canadian Climate Data , which contains more than 22 million rows. Among other steps, each option calculated the average temperature by station and decade. SDA was indeed extremely fast compared with the other options.
Geospatial data
For geospatial data, I used the dataset of all public trees in Montreal (335K). The main computation was counting the number of trees in each of the city’s neighbourhoods. Once again, SDA was a very fast solution.
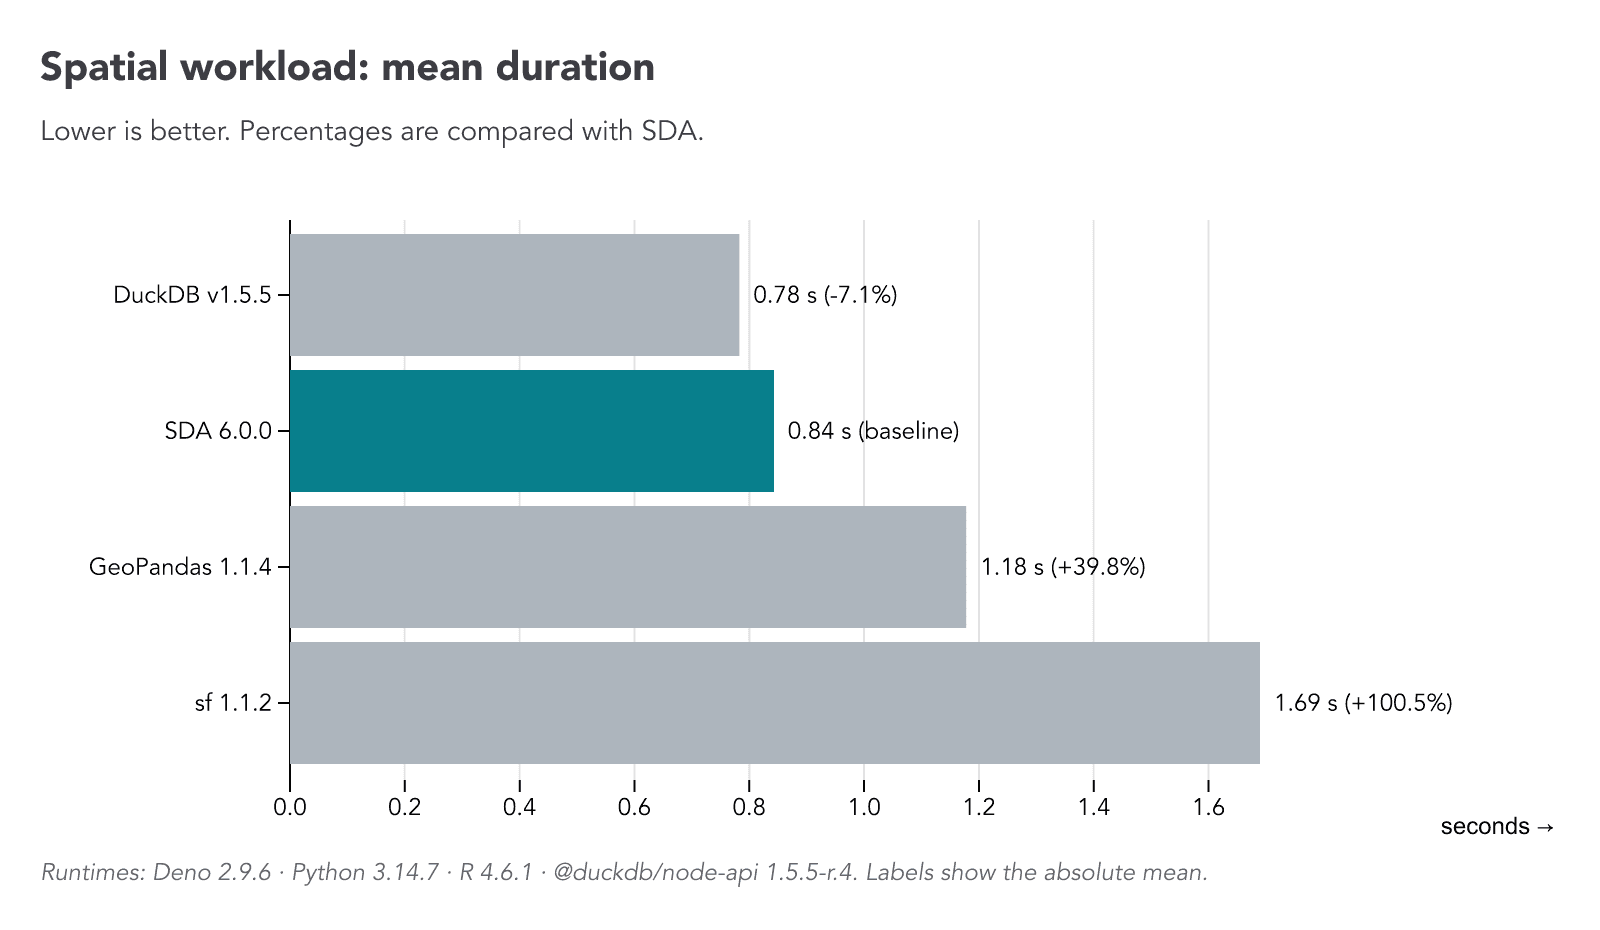
The memory benchmarks tell a similar story. You can review the methodology, code, and latest results in the Simple Data Analysis repository .
Conclusion
That’s it! I hope this project convinced you of how performant the Simple Data Analysis library is.
Nothing is stopping you from crunching massive datasets with TypeScript now! 💃🕺
Keep going with Tabular data or Visualizing data in Chapter 3 to discover more you can do with SDA!